Visualizing the Database
This tutorial demonstrates how to setup a communication with a Node.js server and a Mongo database that stored in mlab, and in addition, how its elements can be extracted and visualized on a client using P5.js.
Introduction
This project demonstrates how to develop a distributed communication and visualization system with Node.js, mongoDB, and P5.js. The system uses a Node.js client to generate data entries, which are then logged in a MongoDB library to our online database in mlab. Using an API (Application Programming Interface), we are able to visualize these entries on our client application with the use of P5.js.
Database with mlab
For this work, mongoDB and mlab are used. MongoDB is a JSON-like database system, which makes it easy to work with many applications and frameworks (especially those developed with JavaScript). mlab is a database-as-a-service with a range of features for quicker and efficient development. Here is a tutorial to get started with mongoDB and mlab.
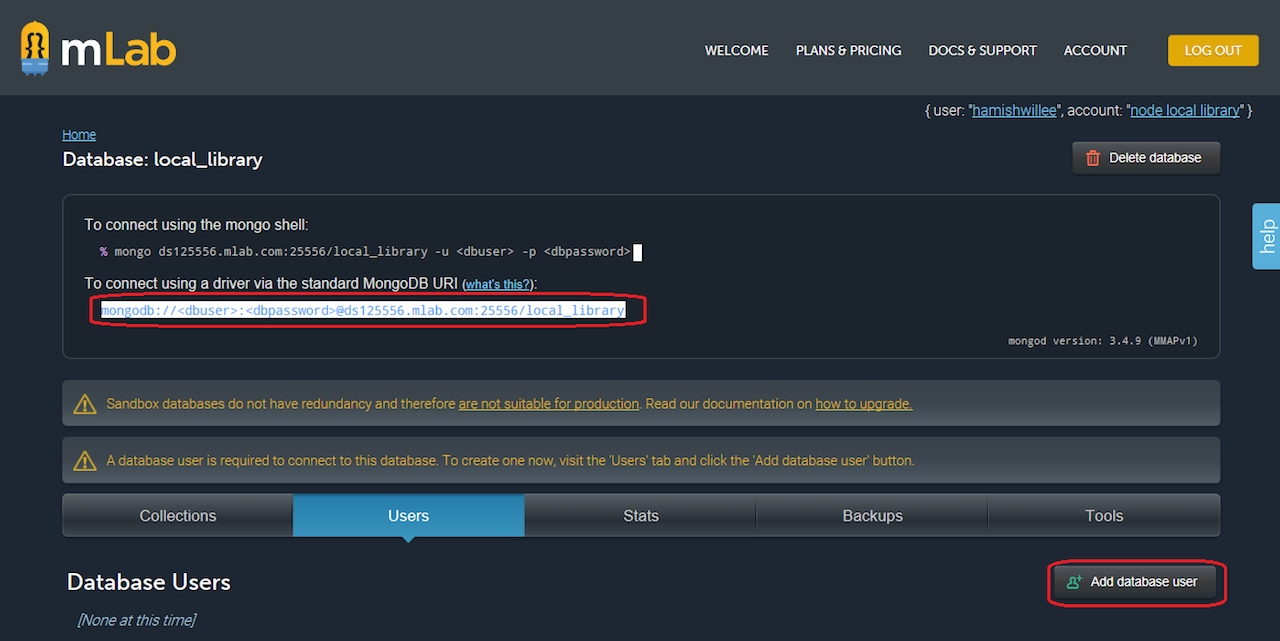
After setting up your free account with mlab, create a new database, a new collection, and a new user. For the database, select the Sandbox mode, AWS, and a region closer to you. After the deployment process finishes, create a new collection (under the Collections tab), and a new database user (under Users, as image below). Finally, you need to get an API Key and activate the Data API. To access this, click your user name on the top right corner of the window.
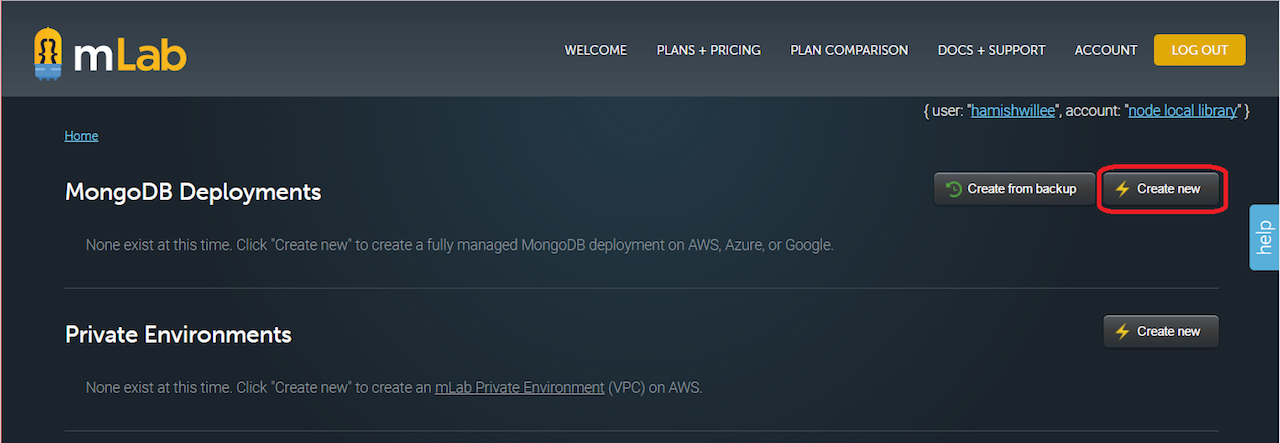
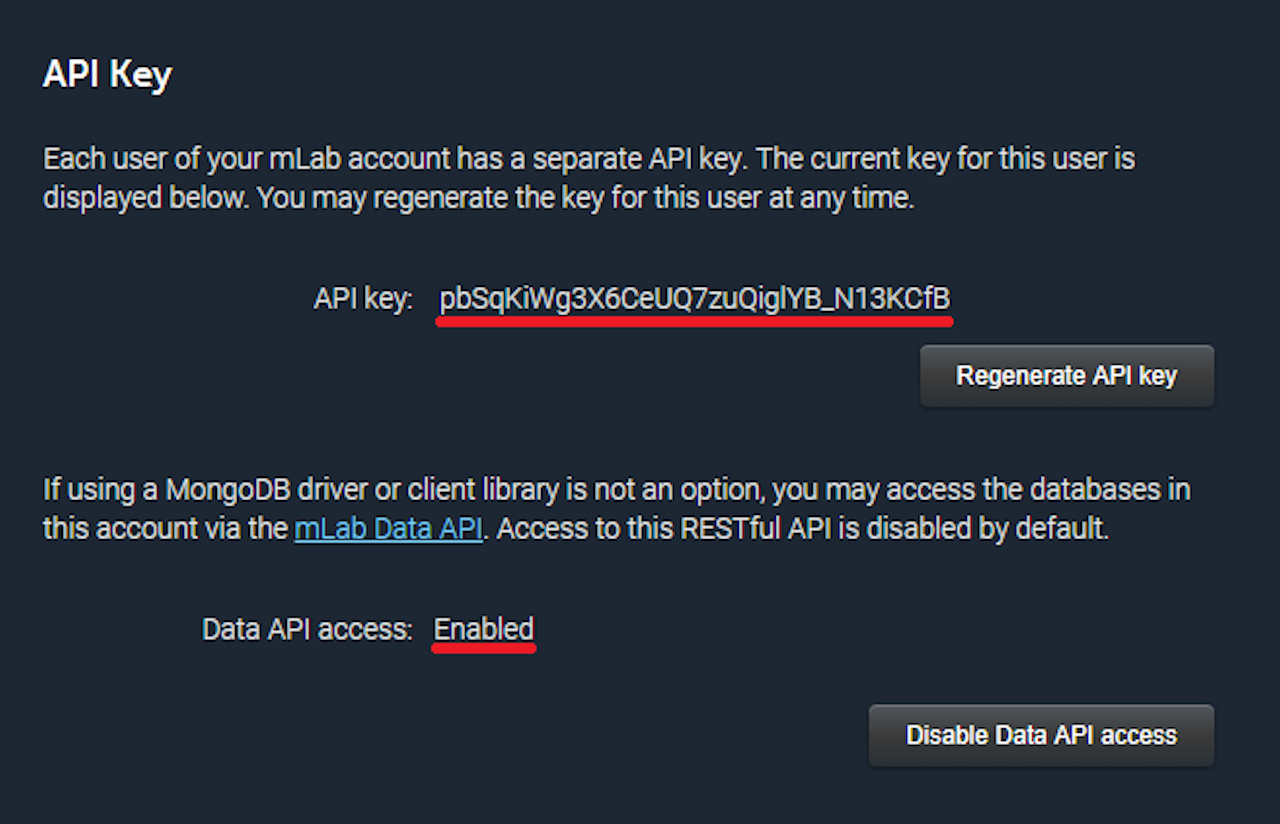
Screenshots taken from here
Node.js Client
To send new data to the database, Node.js will be used here as a client. Make sure you have Node.js on your system – use Terminal (or Command Prompt) and the following command; this will return the current version of Node.js that is on your system. If your system does not have it, download it from here. If you are not familiar with Node.js, check this for a getting started tutorial.
All dependencies for the Node.js project are include in the node_modules folder (in NodeJs-Timelog-MongoDB on GitHub), or they can be installed using the package.json file. Download the project from the GitHub, and use Terminal to navigate to this directory with cd (check this link if you are not familiar with the process). To install them from scratch, run the following in Terminal:
After we make sure that we have the necessary libraries (in this case the mongodb), we import the library into our main.js file. To establish communication with our database in mlab, we have to use the mongo shell, provided in mlab (as in photo above: “Database Settings”). The username and user password refer to the new User you added in your mlab database (not the user account).
Following that, the function getRandomInt() generates a random number everytime that it is called, within a specified ranged (minimum to maximum). This is used later in our P5.js client to generate the position and size of the ellipses that appear on the screen.
The last function used here is the setInterval(function(){ … }, 1000); which creates a loop according to a timing value (in ms) that is set at the end of the closing parenthesis – in this case 1000. Thus, every second we generate new random values for the variables randomX, randomY, and randomRadius (when calling the getRandomInt function and assigning the returned value to each separate variable), and also we create a new variable that contains current time and date.
While the loop of this function is every second, the data are sent to the database just once for every minute. When the current second of the system equals to “0”, the mongoLog variable will create a JSON object that contains our four values, and pass them on to the MongoClient object. Here, make sure that the db.collection has the name of the Collection that you set in your mlab database. If everything is set properly, then the code will return the message “Data added”, and then repeat the same process after one minute.
To execute the code above, make sure that you set in Terminal (or Command Prompt) the current directory (cd) for this NodeJS folder. Use the following command to start.
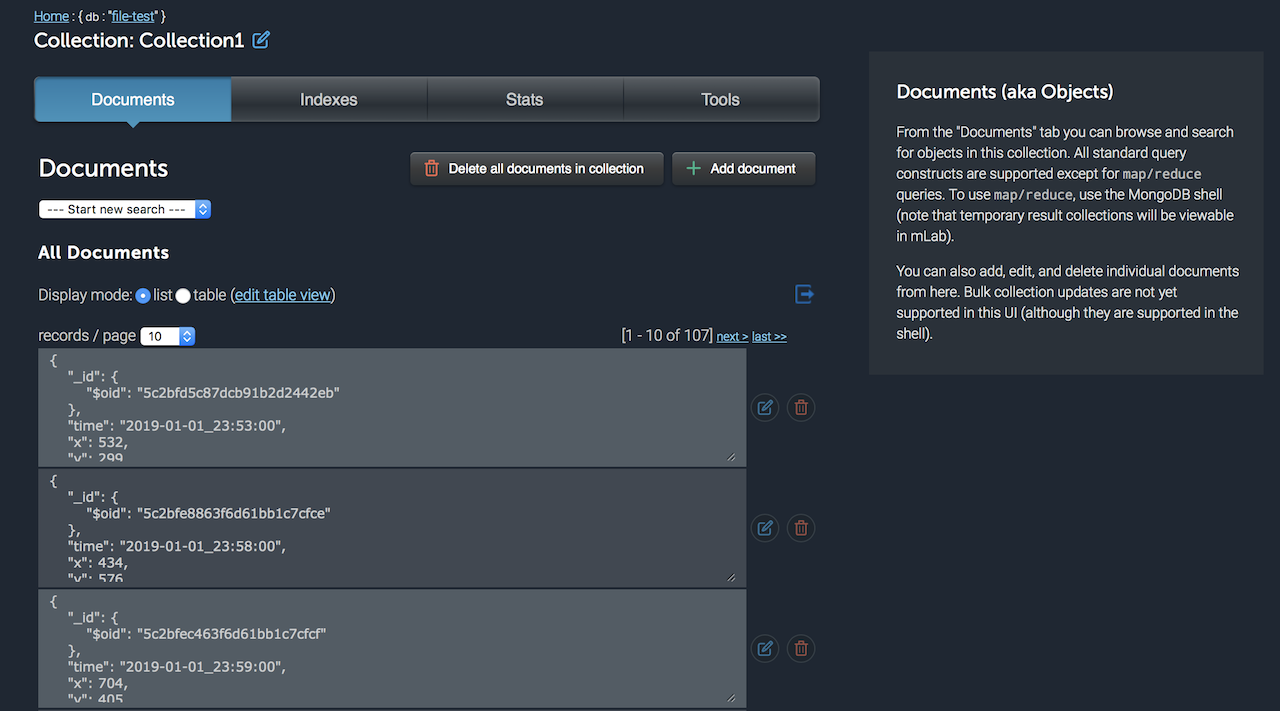
If everything is properly set in your code, you will see on your Terminal the data values as below. The data entries will also appear in mlab – inside the Collection that you used.
Visualizing in P5.js
P5.js is used here to create a simple visualization of the database values that we created. P5.js is a JavaScript library used by artists and designers in creating interactive media content for the web – here is a getting started guide if you are not familiar with the library.
For this work, we use the values of the database entries to generate properties for the visualization – corresponding to position and size of the shapes that appear on the screen. To accomplish this, we make use of mlab’s API, which returns a JSON object with all database entries. By creating a for loop in the drawData function, we access all values individually, and assign them to the drawing settings of the shape – i.e. x and y define the location of the shape, and the radius the size. Color is generated for each shape – size of the array depends on the database.
The code also works dynamically (in real-time). As the database grows, a new entry is visualized on the screen, with the new shape responding to the location and size values of the database – color is also dynamically generated with random values for RGB.
To execute this code, open the index.html file in Chrome (recommended), or use the Atom Live Server (instructions how to install and use it, here).
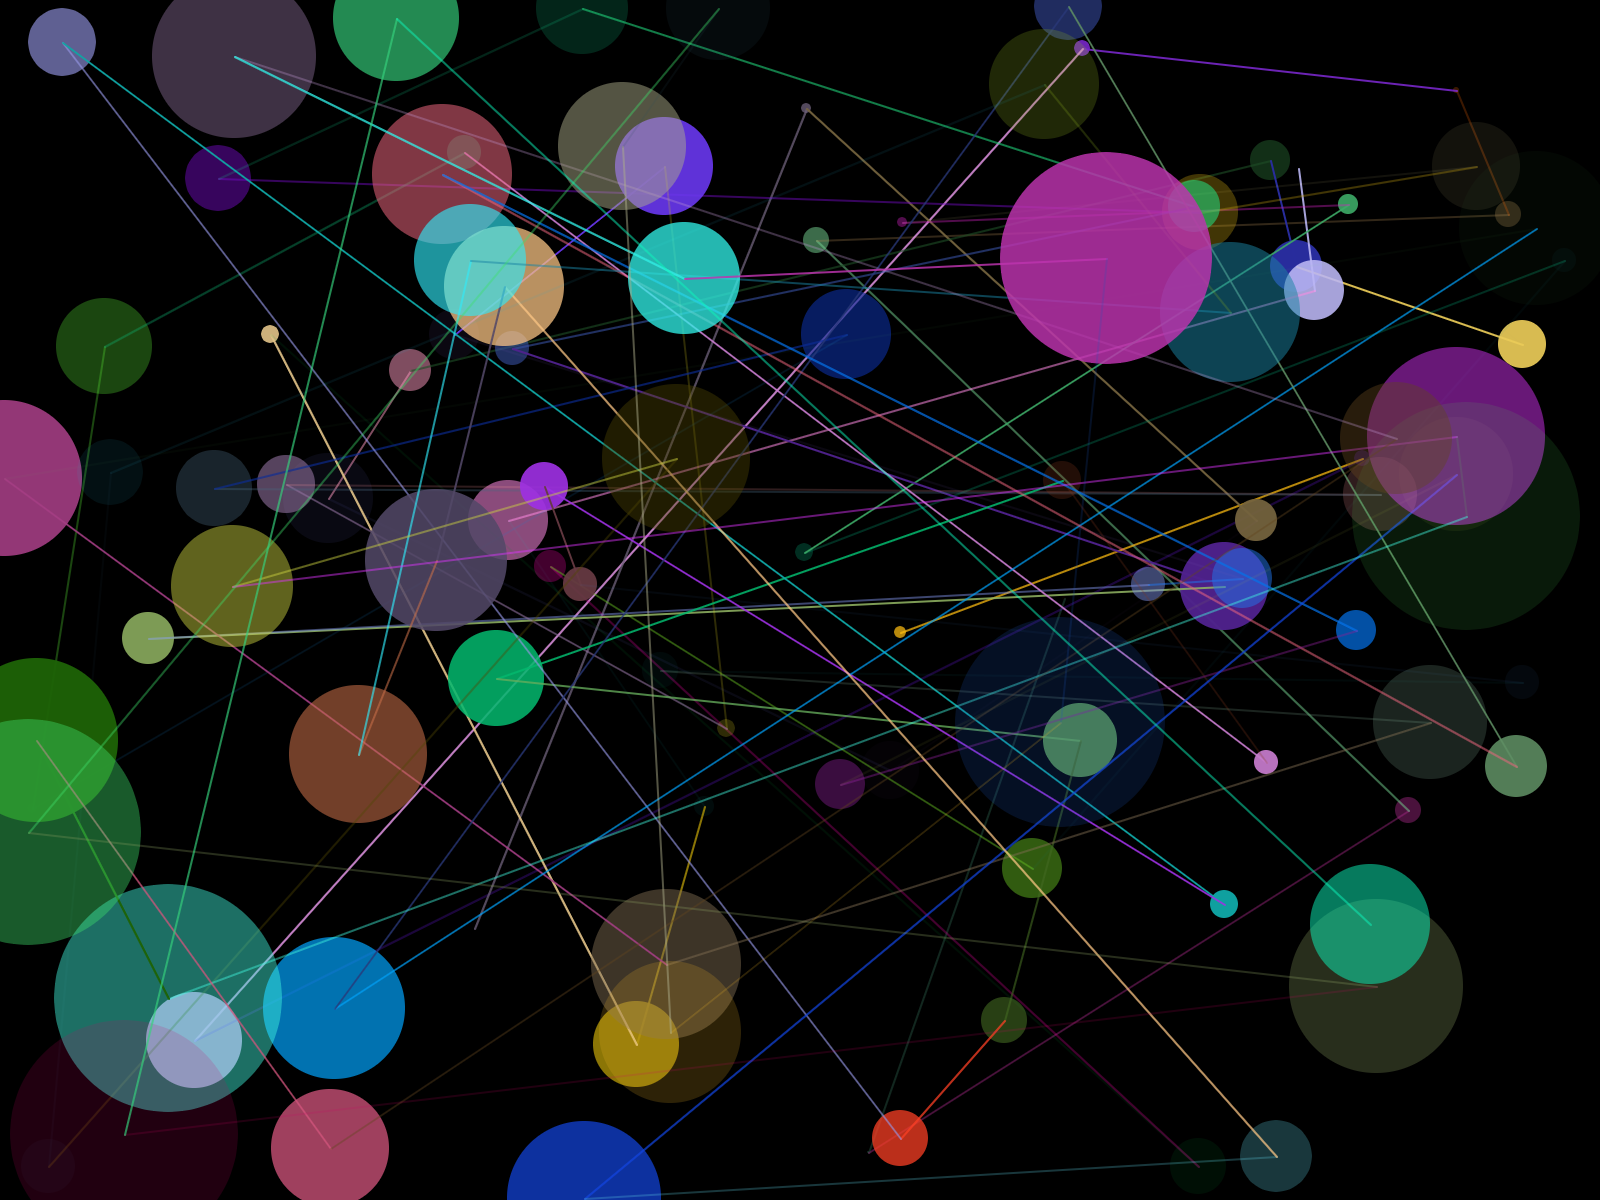
Image from the P5 database visualization: